
From scanner to product: building GammaJuice
Turning a Python squeeze scanner into a signals product — a dashboard, a content site on a headless CMS, automated social posts and the engagement data that changed what we publish.
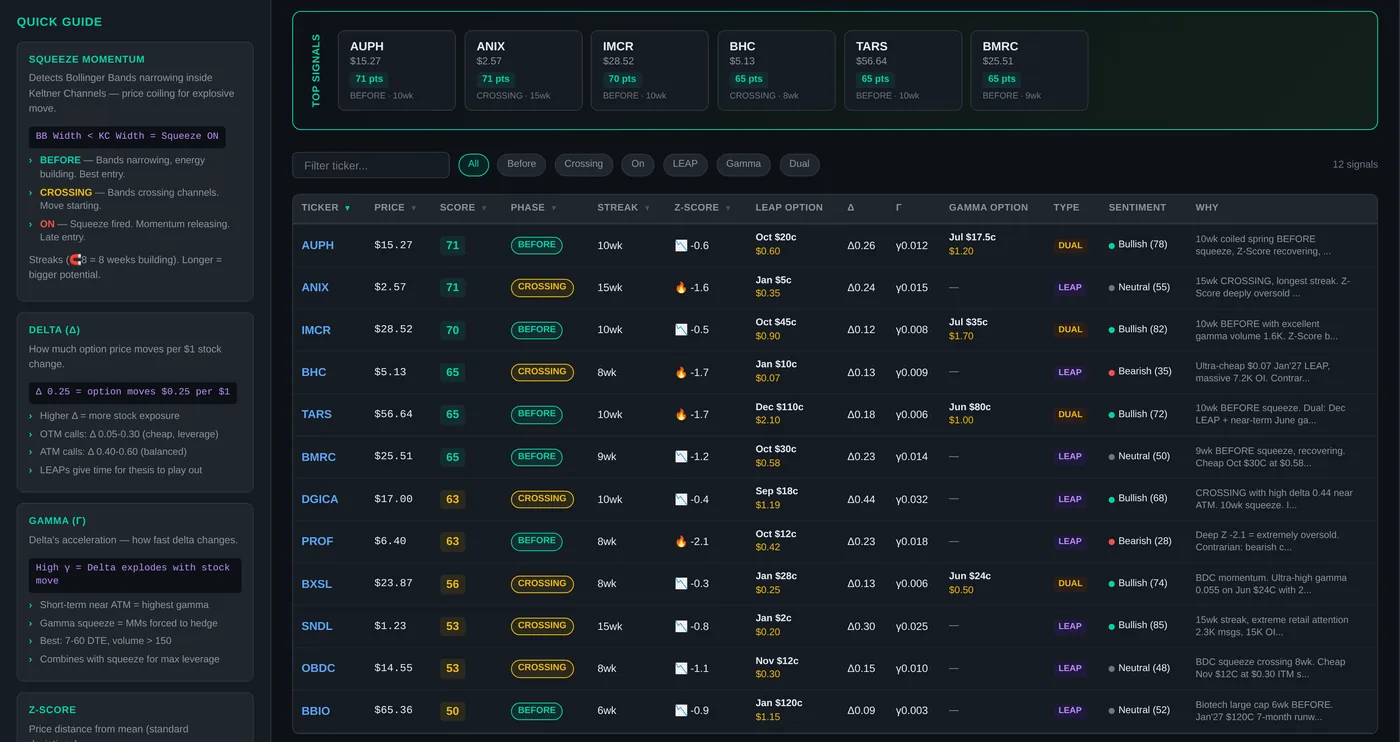
A scanner that prints to a terminal is a tool. A scanner other people can use is a product — and almost all of the work is in the gap between the two. GammaJuice is what the 3WT squeeze scanner became when I tried to close that gap.
GammaJuice is an education and research tool. Nothing here is investment advice.
The pipeline
Underneath, it's the same daily pipeline as the scanner:
- Refresh the stock universe weekly (about 3,700 small, mid and micro caps).
- Scan after the close for squeezes and three-week-tight consolidation.
- Track every signal over time — score, phase, streak and week-over-week changes.
- Enrich the survivors with options candidates and sentiment.
- Publish: dashboard, Telegram, social posts and the content site.
Each step is a small Python script with one job, scheduled by an agent runner. When a step breaks, it's obvious which one.
The dashboard: explain before you show
The first version was a table of numbers, and it was useless to anyone but me. The fix was the quick guide down the left side: what a squeeze is, what "before", "crossing" and "on" mean, what delta and gamma tell you. Every column in the table maps to a sentence in the guide.
The second fix was the "why" column: a one-line, plain-English reason for each signal. A score of 71 means nothing. "Ten weeks coiled before the squeeze, Z-score recovering" is something a person can evaluate and disagree with.
Content on a headless CMS
The public site is built with Astro and pulls articles, authors and signal tables from a Directus CMS. Writers work in the CMS; the site rebuilds as static pages with structured data for search. It's the same split I use on most content projects: editing in one place, a fast static site in another, and an API between them.
Charts people actually share
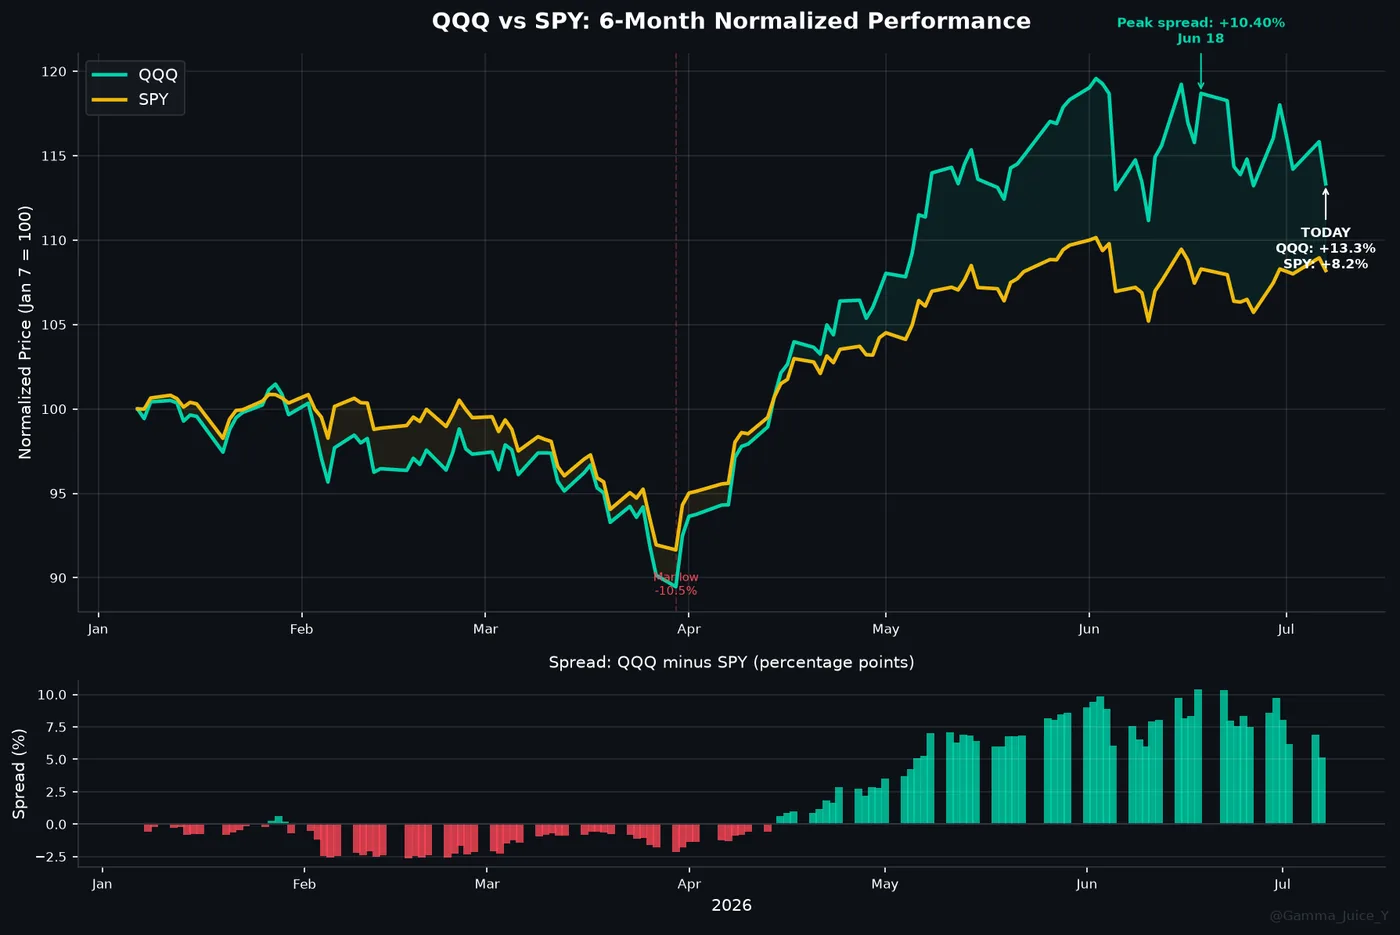
Market context charts are generated automatically and posted with the daily notes. Simple, dark, readable on a phone, and labelled with the one number that matters.
What the engagement data said
Social posts go out through Buffer, which made it possible to compare formats. Across 79 posts, the ones naming specific tickers averaged a 4.71% engagement rate, against 2.06% for posts without. The best performers combined a ticker, a clear setup and levels to watch — and, occasionally, a joke at our own expense.
That's a small sample, and engagement isn't the same as usefulness. But it changed what we publish: fewer general market musings, more specific, checkable setups.
Honesty is a feature
Building the product made me more careful about the numbers, not less. Signals are tracked forward from the day they first appear, with that date recorded, so performance is measured from a point nobody chose after the fact. And when a backtest looked too good, I read the code and found out why before it went anywhere near a marketing page.
The lesson from twelve years of sales systems applies here too: people can tell when a number is trying to sell them something. The fastest way to earn trust is to show your misses next to your hits.
Some links in these notes are affiliate links. If you buy through one, I may earn a commission at no extra cost to you. I only link to tools I use or would recommend.