
Backtesting a squeeze scanner without fooling myself
A thin edge, two filters that sounded smart and didn't help, and a liquidity effect hiding in plain sight. What 2,633 historical signals from the 3WT scanner actually said.
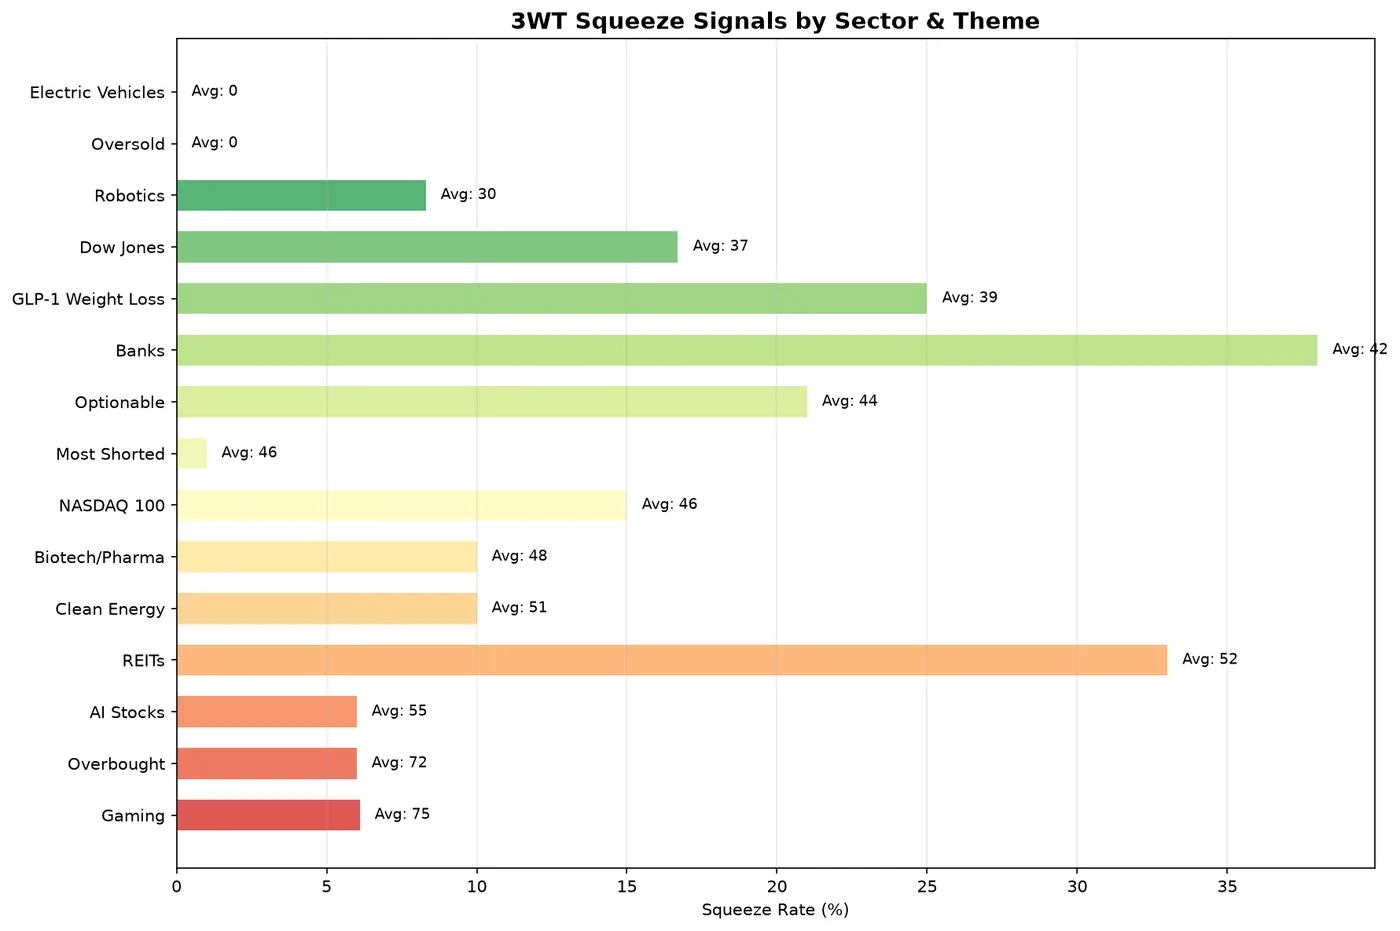
The 3WT scanner looks for stocks that have gone quiet. It checks roughly 3,700 small, mid and micro-cap tickers for two patterns: "three weeks tight" (weekly closes within about 3% of each other) and the classic squeeze, where Bollinger Bands contract inside Keltner Channels. When it finds one, it attaches long-dated LEAP and shorter-dated options candidates and tracks the signal week over week.
It's a satisfying thing to build. The data pipeline, the scoring, the sector heatmaps, the Telegram reports — all of it works. The harder question is whether any of it means anything.
None of this is investment advice. It's a record of testing my own tool.
The baseline: a thin edge
The plainest test treats every historical signal as a stock trade: enter at the signal, 10% stop, 20% target, 14-day maximum hold. Over 2,633 trades:
| metric | value |
|---|---|
| win rate | 44.8% |
| average trade | +0.44% |
| average win / loss | +10.3% / −7.6% |
| profit factor | 1.11 |
| most common exit | max hold (1,243) |
A profit factor of 1.11 is an edge, but a thin one — before costs, which I haven't verified the backtest models. It's the kind of number that's easy to destroy with slippage and easy to inflate with a little optimism. So the next step was to see whether the obvious improvements improved it.
Filter 1: follow the options flow
The theory is popular: unusual bullish options activity is "smart money" positioning, so squeezes with bullish flow should do better. I split the trades by whether they had two or more bullish flow signals.
They didn't do better. With bullish flow (111 trades): profit factor 1.15. Without (1,497 trades): 1.29. Whatever the flow signal measures, it didn't add edge here.
The interesting split was one I wasn't looking for. Tickers with no options data at all — 1,025 trades — lost money, with a profit factor of 0.91. That's not a flow effect; it's a liquidity effect. Stocks too thin to have an options market behave differently, and dropping them is the most promising filter in the whole exercise.
Filter 2: confirm on multiple timeframes, tighten the stop
The second idea was to require agreement across timeframes and use a tight 3% stop to cut losers early. Over 112 trades: 22% win rate, profit factor 0.65. Eighty-three of the 112 exits were the stop.
On small caps, 3% is inside ordinary daily noise. The filter didn't find better trades; the stop just harvested normal volatility as losses.
What I'm keeping
- The baseline stays the yardstick. Every new idea has to beat profit factor 1.11 on the same trades, not on a fresh, flattering sample.
- Liquidity is the lead. "Has an options market" is a cheap, mechanical filter with a real split behind it.
- Stops have to respect the instrument. A stop tighter than daily noise is a cost, not a safety feature.
The scanner also gained an "academic overlay" — cross-sectional momentum, short-term reversal and a market-regime term blended into the score. It's principled and it's implemented. It isn't validated against this baseline yet, so for now it's a hypothesis with good manners.
The next note covers the result I trusted least: an 80% win rate that wasn't.